WebTrend
Indicators
Get exclusive access to our indicators
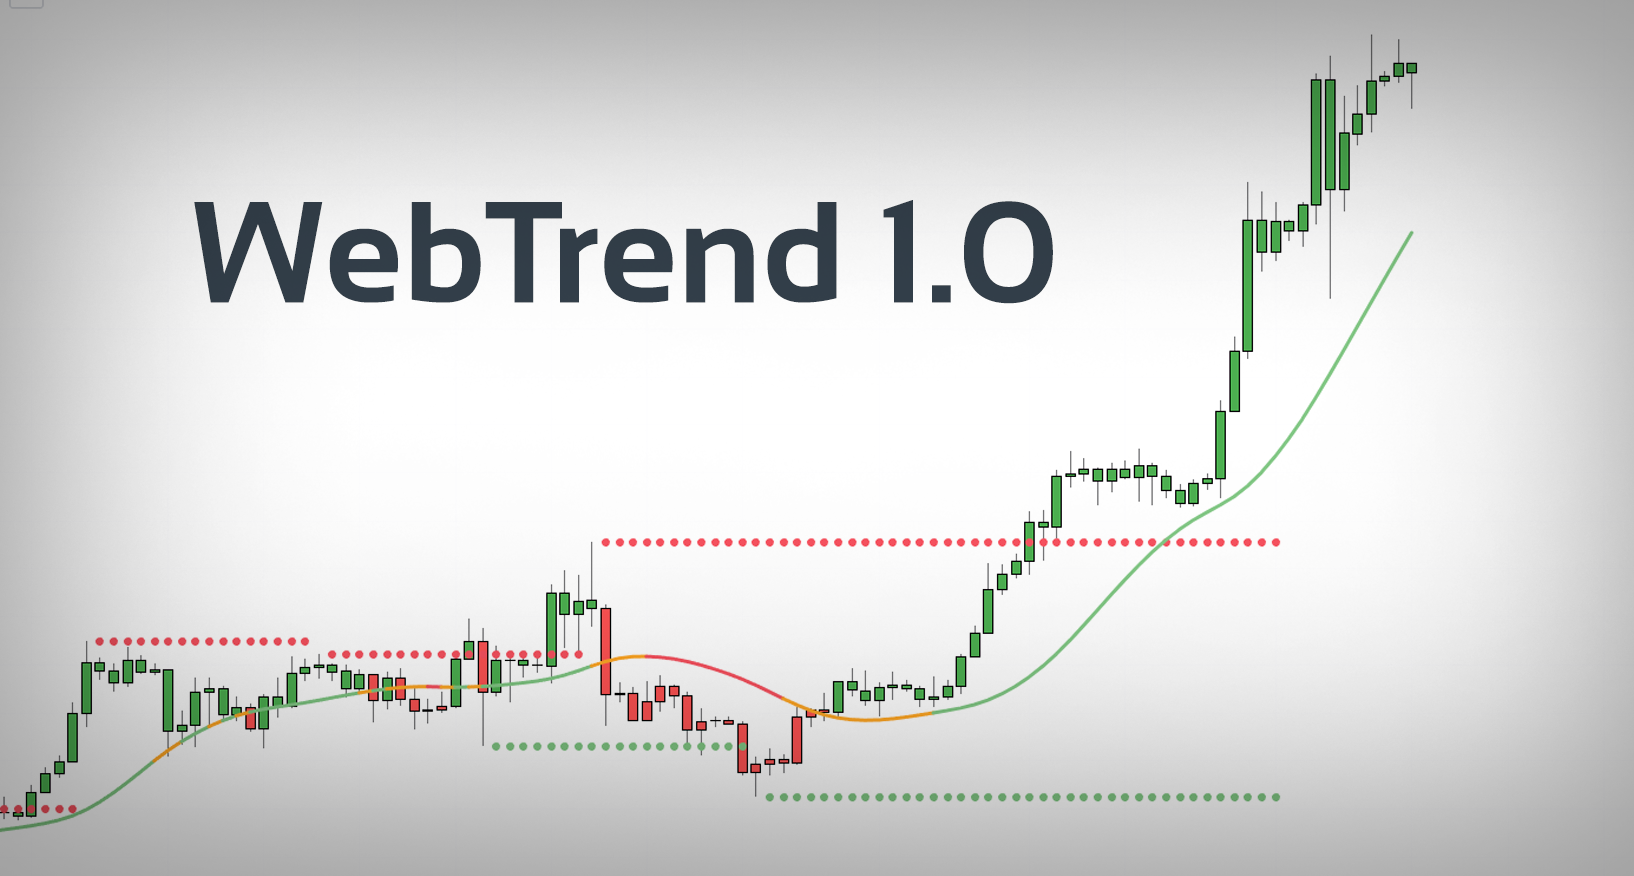
Our Easiest-to-use Indicator
WebTrend 1.0 is great for both beginner and experienced traders. This gives you a great visual on the go that automatically marks key support and resistance levels, trend line identifiers, and our dynamic candlestick overlay.
Great For Long-term Systems
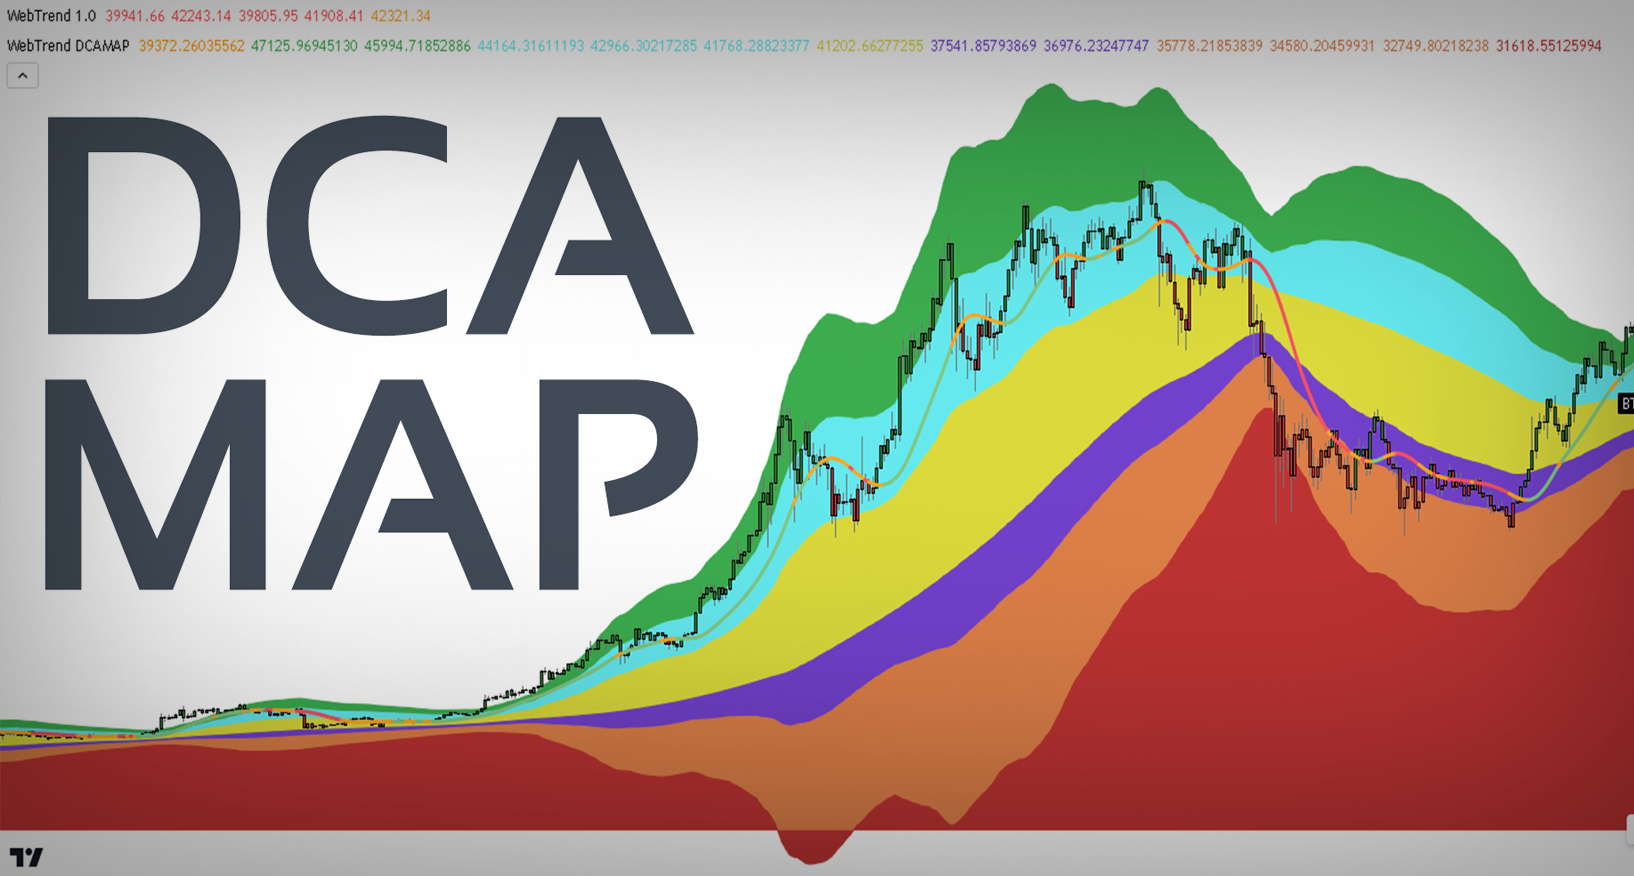
Our DCA Map indicator visualizes the current stages of the market so you can see when the optimal times are to start DCA'ing in the market and vice versa.
It's All In The Name
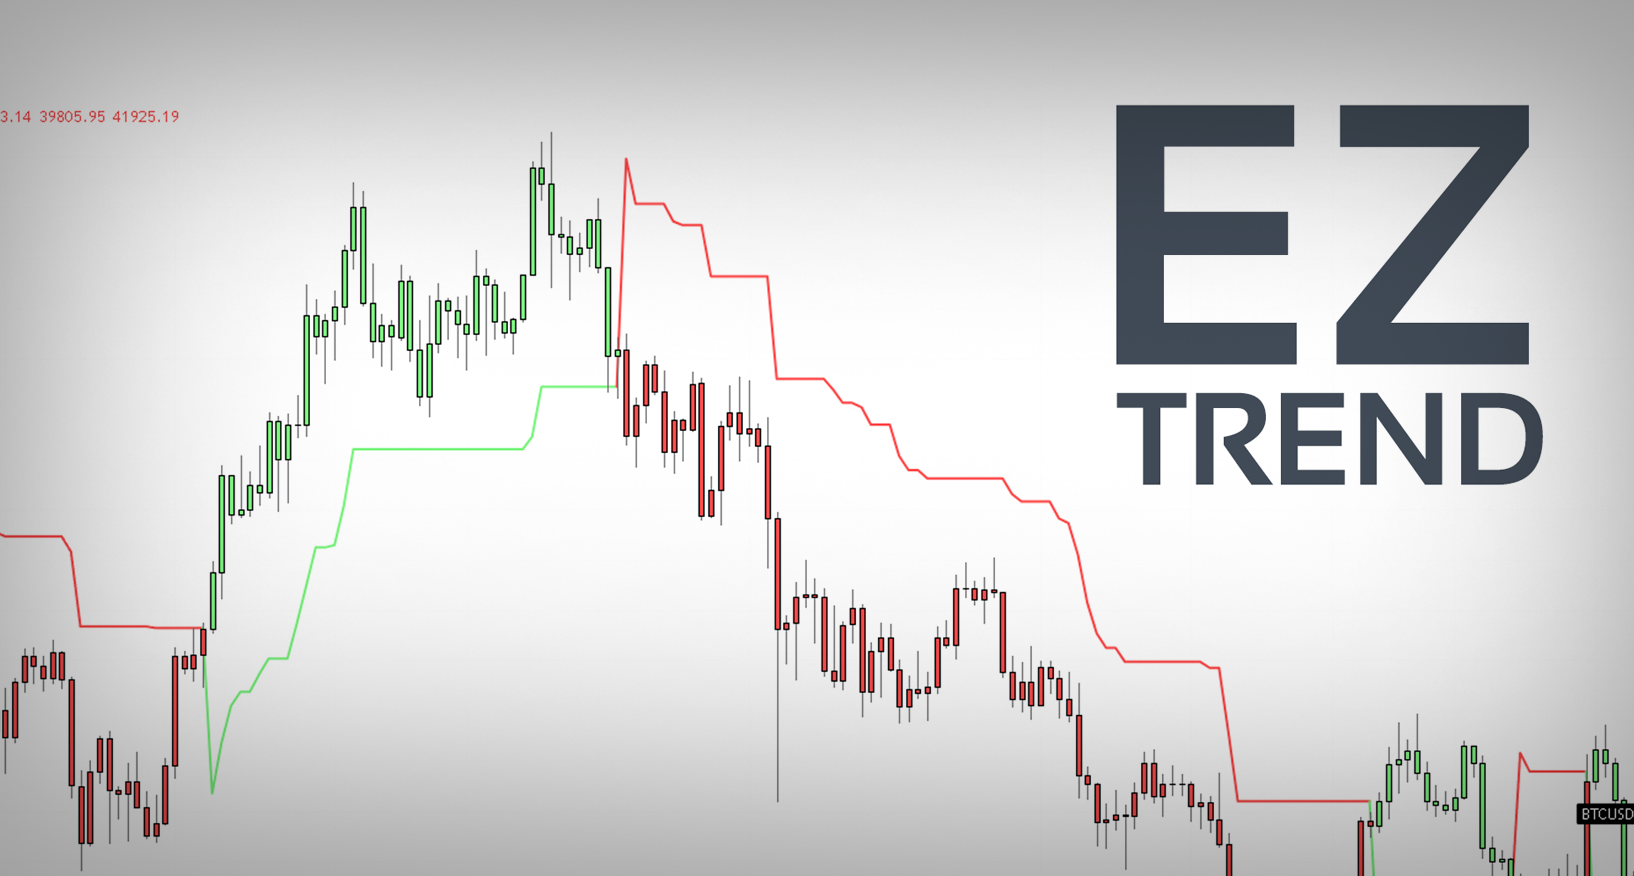
The EZ Trend indicator visually tracks upward and downward market momentum, signaling potential trend shifts.
Make Your Chart Glow
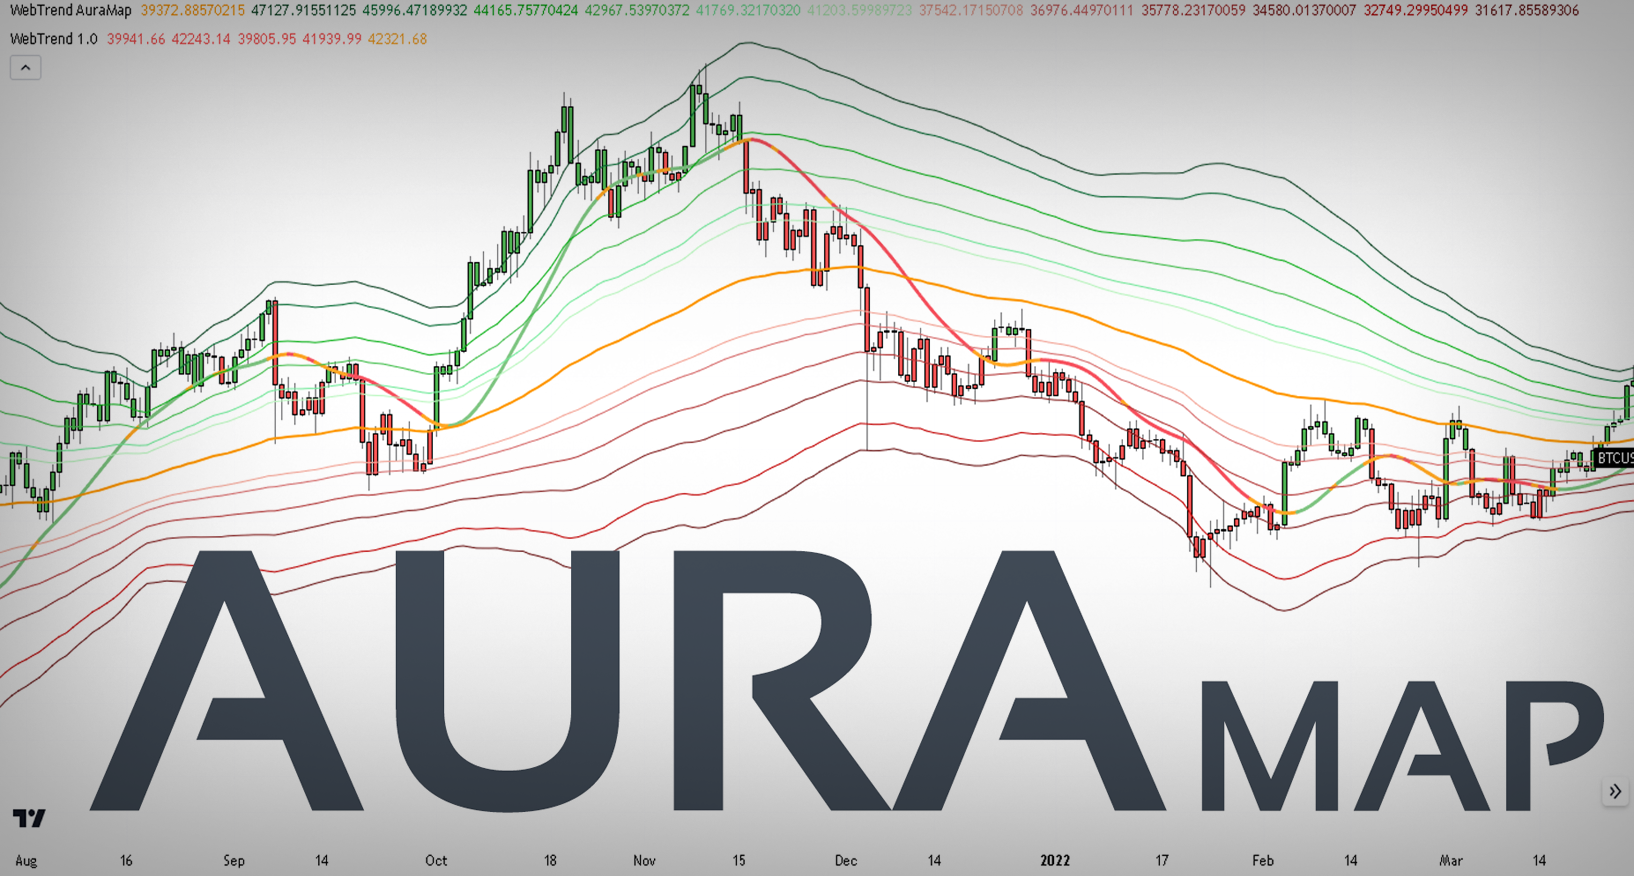
The Aura Map indicator employs multi-layered trend lines to outline support, resistance, and volatility levels.
Spot Momentum Shifts
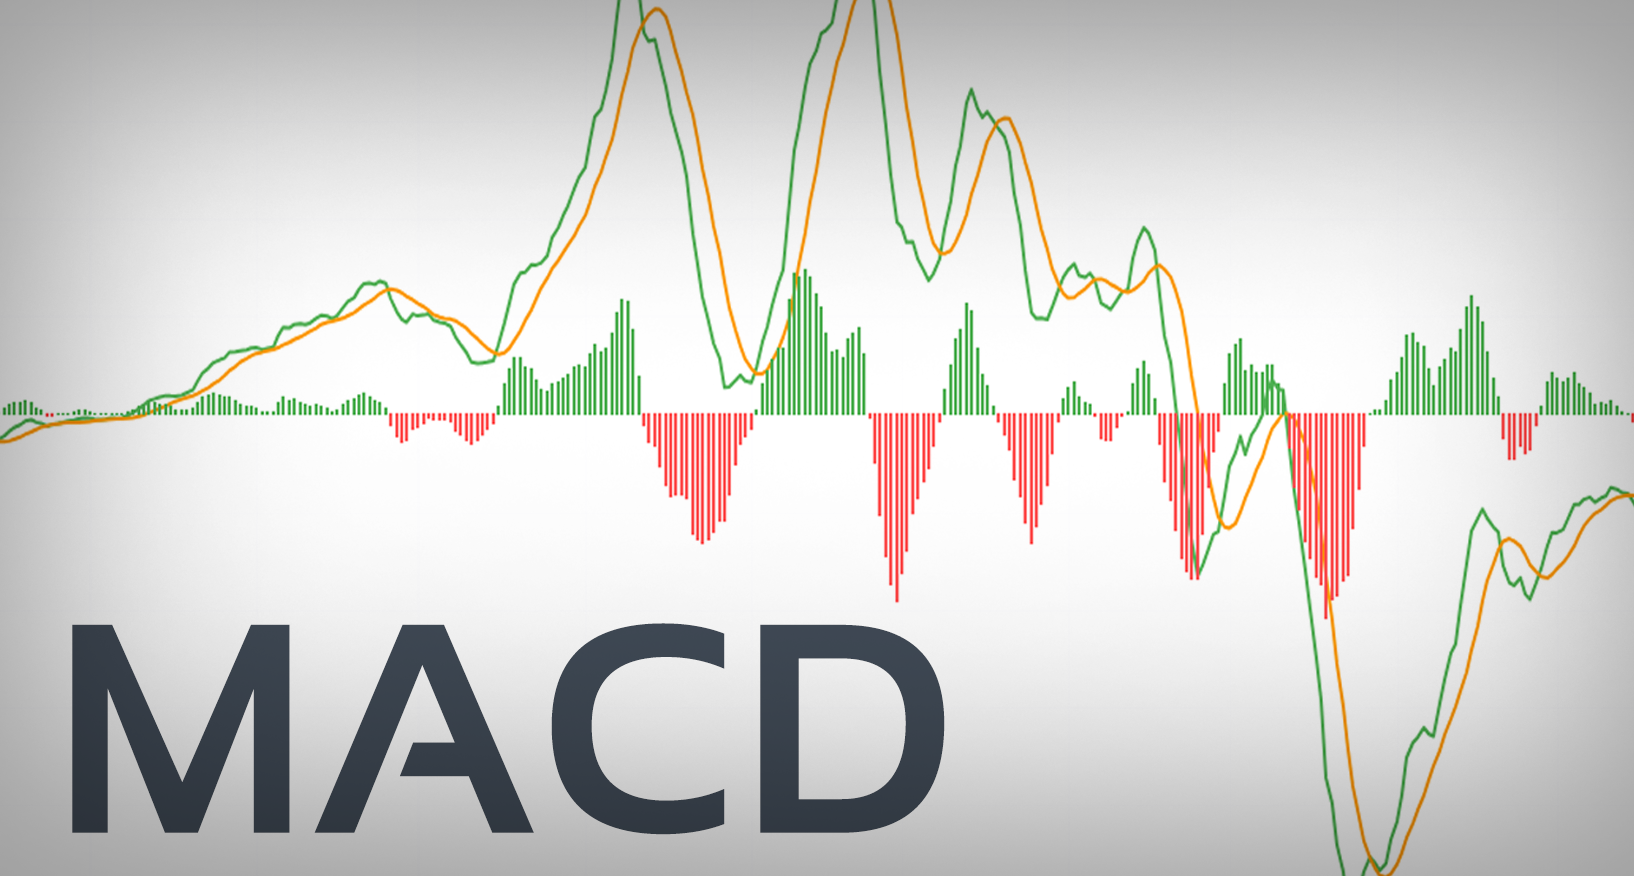
Our MACD displays momentum and trend changes by measuring the divergence between two moving averages.
Make Trend Intuitive
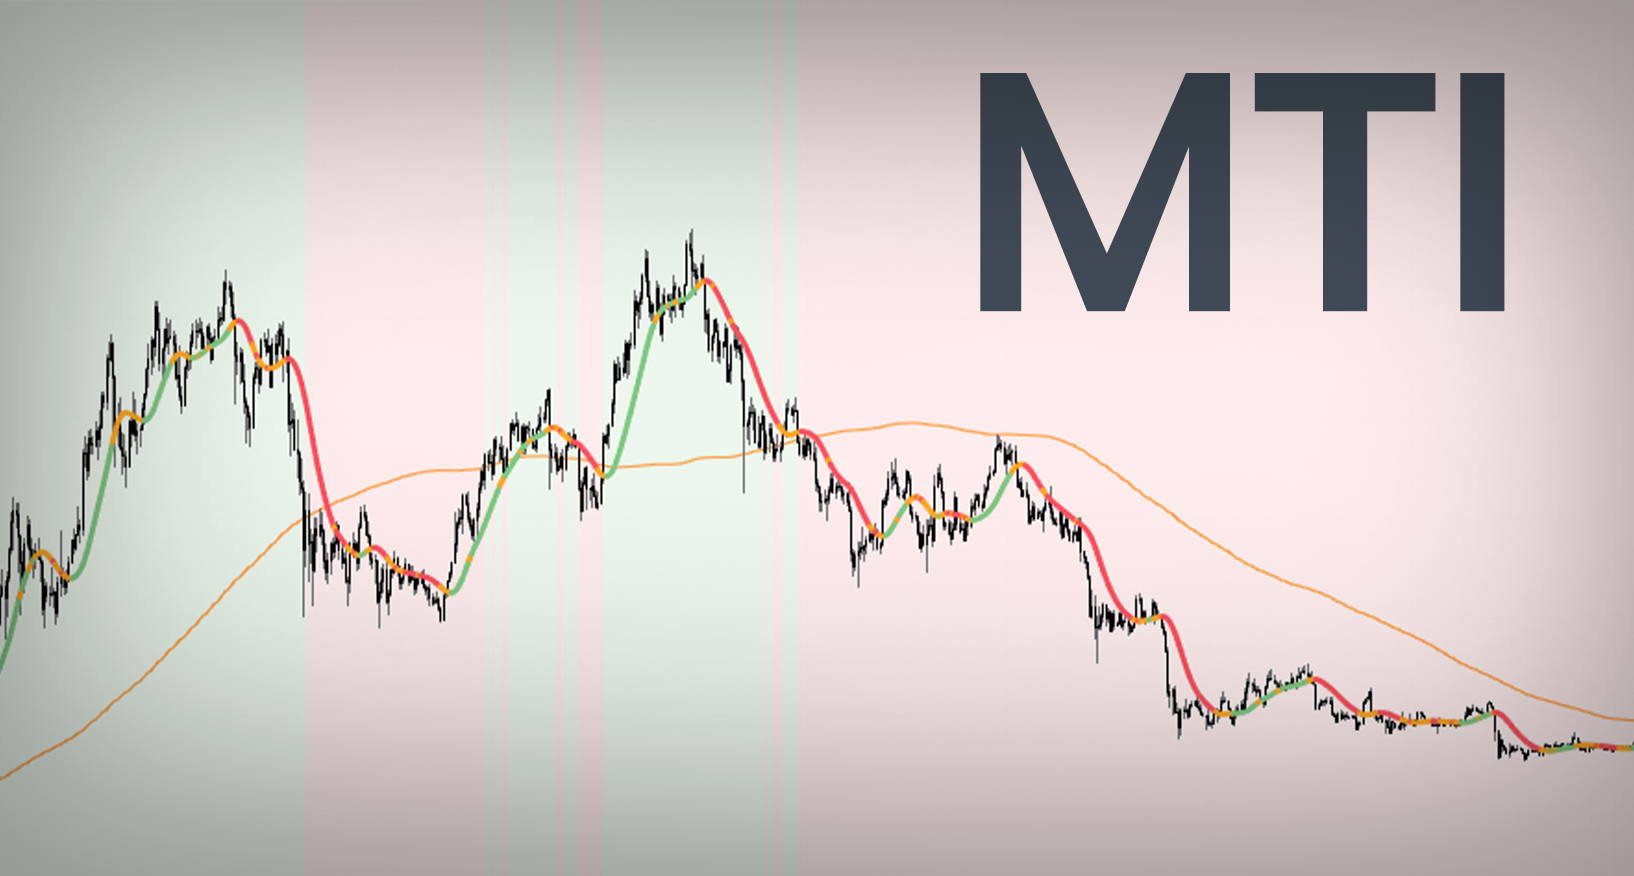
The MTI uses price movement averages to gauge market trends and volatility, aiming to predict potential changes.
Over and Under
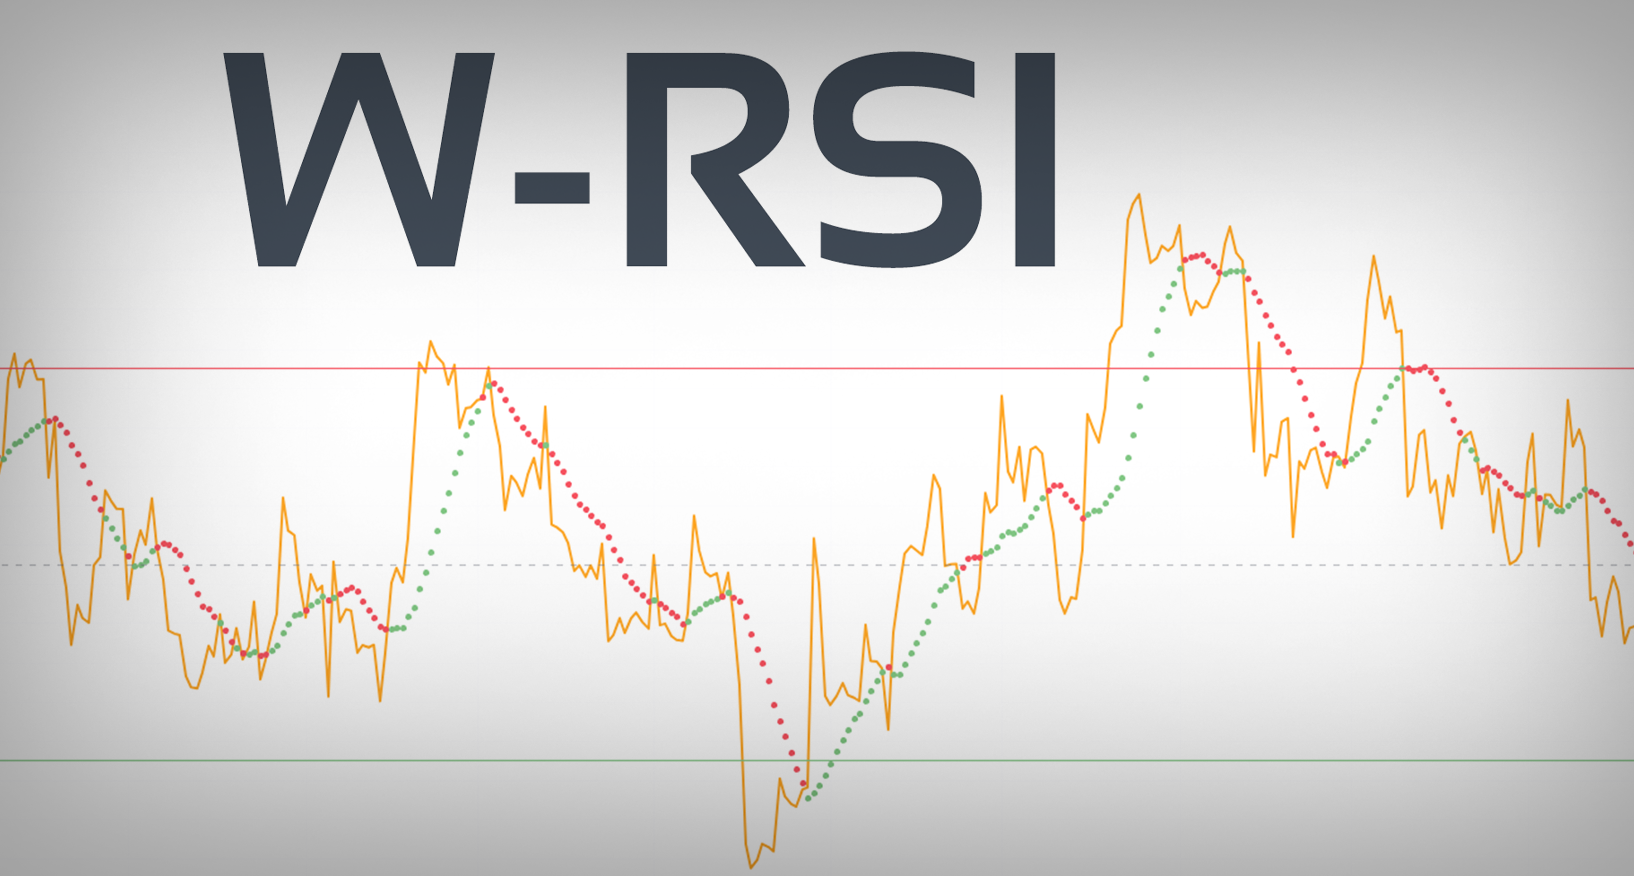
The W-RSI indicator measures asset overbought or oversold conditions to suggest potential reversals.
All the basics
We cover all the normal indicators you would see in the simple trader tool box.
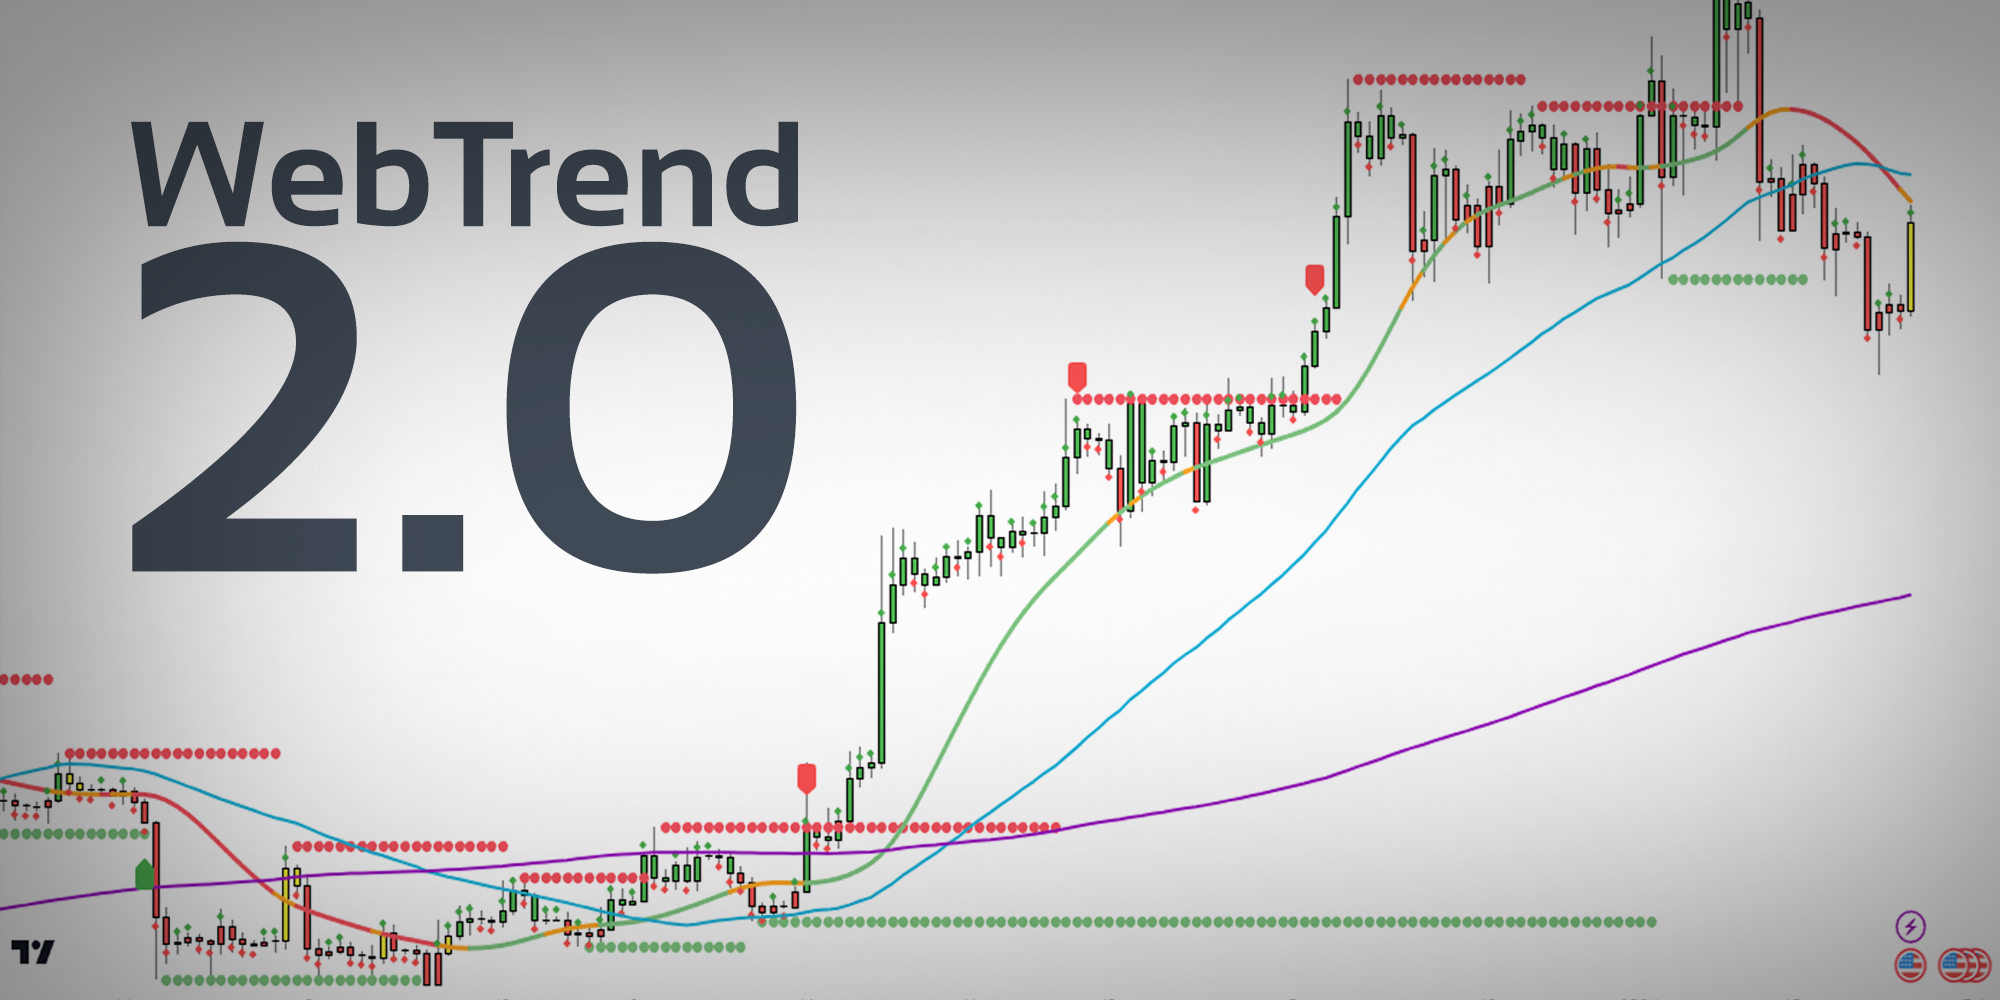
Looking for WebTrend 2.0?
This indicator is our most advanced. For traders looking to take their game to the next level, click below!
